Skip to content

Explore

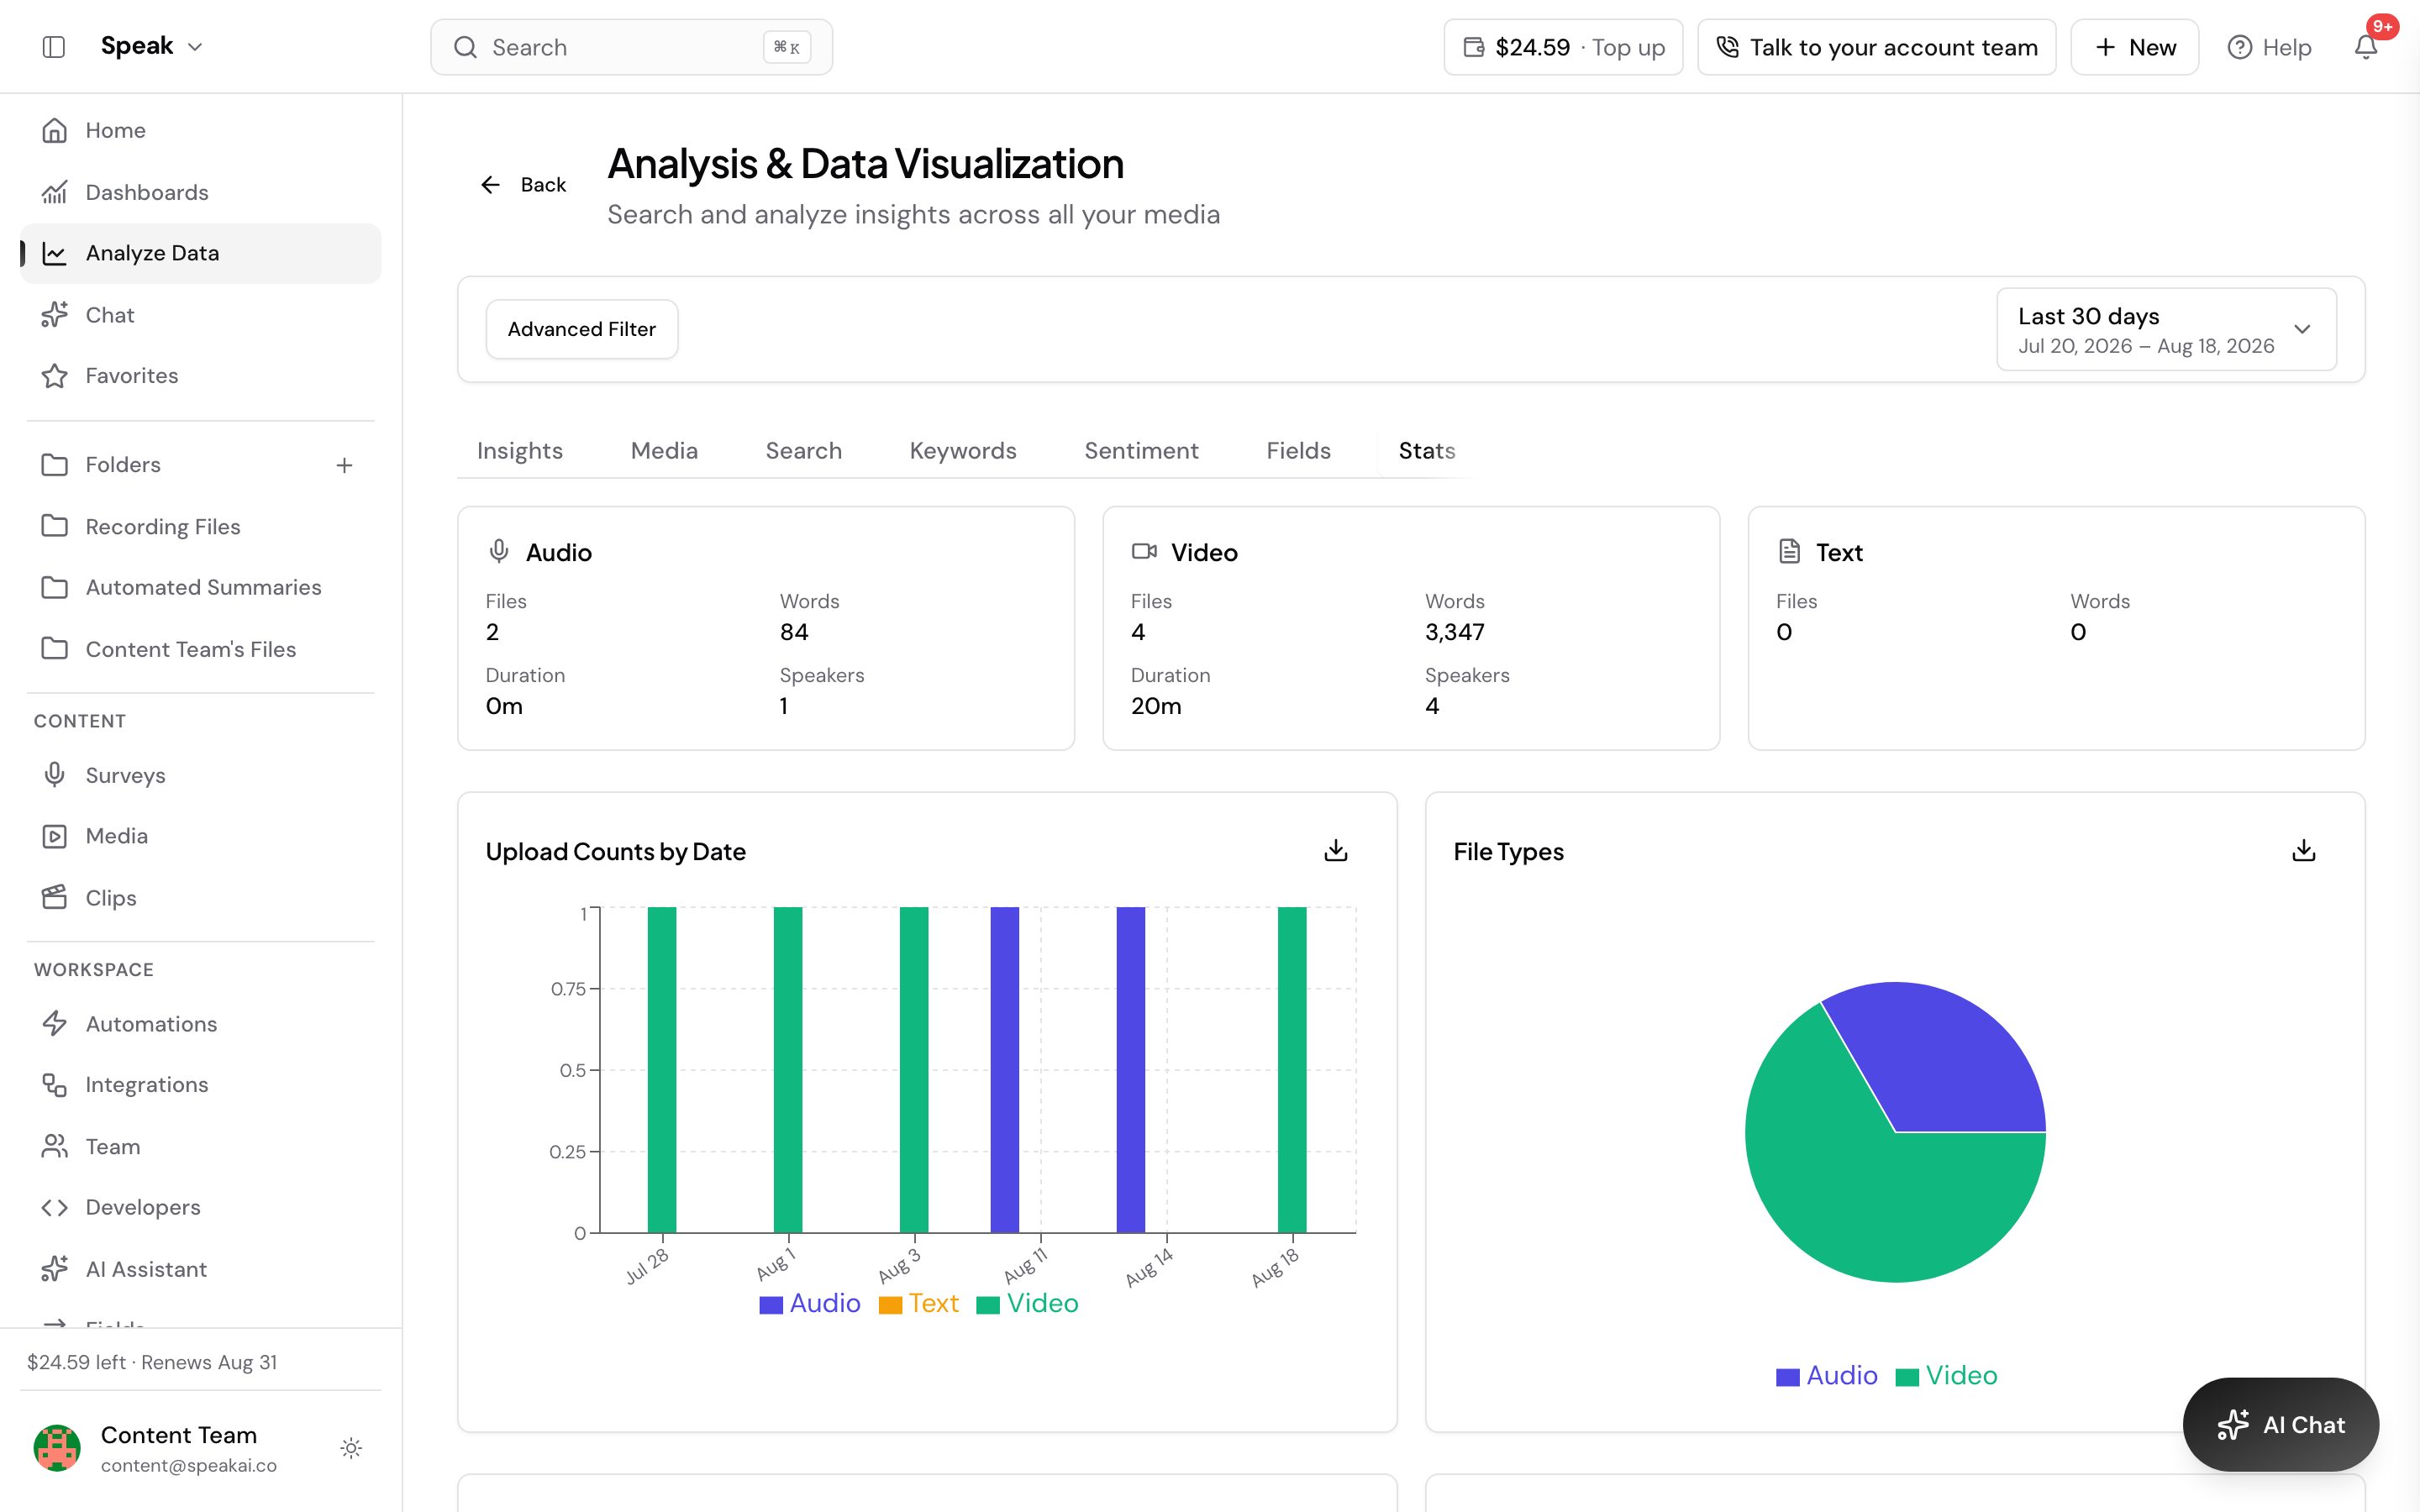
The Explore page compares insights across your whole library instead of one file, surfacing patterns, trends and shifts over time.

Updated View as MarkdownAsk ClaudeOpen in ChatGPTllms.txt

What is the Explore page?

The Explore page lets you analyze insights across all your recordings in one place. Instead of looking at individual files, you can see patterns, trends, and comparisons across your entire library or specific folders.

What you can analyze

  • Keywords: Which terms appear most frequently across recordings
  • Sentiment: How sentiment changes over time or across different groups
  • Topics: Common themes emerging from your content
  • Speakers: Compare speaking patterns across multiple recordings
  • Entities: People, organizations, locations mentioned across files

Filtering your data

Use advanced filters to focus your analysis:

  • Folders: Analyze specific project folders
  • Date range: Look at trends over time
  • Speakers: Focus on specific speakers
  • Sentiment: Filter by positive, negative, or neutral
  • Tags: Group by custom tags
  • Categories: Filter by insight categories

You can create AND/OR conditions across multiple filters and save your filter configurations for reuse.

Visualizations

The Explore page displays your data as charts and tables. You can also generate custom visualizations through AI Chat:

  • “Create a pie chart of sentiment distribution”
  • “Show a bar chart of top keywords this month”
  • “Generate a doughnut chart of speaker distribution”

Use cases

  • Research: Identify themes across 50+ interview transcripts
  • Customer success: Track sentiment trends across support calls
  • Sales: Find the most common objections across all sales calls
  • Content: Discover which topics come up most in your podcast episodes

For more on filtering, see our Advanced Data Filtering guide.

Advanced data filtering allows you to create your condition to visualize your data on the Explore Insights page.

You can create filters with multiple AND / OR conditions on all attributes to include and exclude data for highly relevant insights.

.

These filters currently include the following:

  • Speakers
  • Sentiment
  • Tags
  • Categories Insights
  • Folders
  • Time

Once created, you can easily save your filters from revealing what matters most to you repeatedly.

Overview

Ever wondered if your support calls tend to increase on Mondays, or if customer sentiment is generally better on Fridays? This feature allows you to uncover these kinds of recurring patterns in your data.

By analyzing trends based on the day of the week, you can gain valuable insights into your customer interactions and operational patterns. This helps you to better understand your workload, identify potential issues, and optimize your resources.

How It Works

You can use the Date Range picker in the Dashboard or Explore view to analyze data for specific days. While you can’t directly select “Every Monday,” you can select individual dates. For more advanced analysis of day-of-week trends, you can export your data as a CSV file and use spreadsheet software like Excel.

Getting Started

To access this feature, go to Dashboard or Analyze Data in your Intercom account.

Step-by-Step Guide

\1. Select Date: Click the calendar icon in the top right of your Dashboard or Explore view. Select a specific single day (e.g., “Oct 13 to Oct 13”).

\2. Observe: The dashboard charts will update to show only that day’s volume, sentiment, and keywords.

\3. Advanced Analysis: For recurring trends (e.g., “All Mondays”), go to Explore, select all files, and click Export CSV. Open the CSV in Excel and use a formula like =WEEKDAY(Date) to group your data by day of the week.

  • Data Export
  • Date Filtering

Pro Tips

Creating a “Monday” tag and auto-tagging files based on their creation date (via Zapier) is a powerful automation workaround for identifying specific days.

Troubleshooting

Timezone Issues: Ensure your account timezone matches your local time. This way, when you select “Monday,” it accurately reflects your local Monday.

Next Steps

Ready to uncover your day-of-week trends? Here’s what to do next:

  • Login to your account and navigate to the Dashboard or Explore view.
  • Try it out by selecting a specific date to see how the data changes.
  • Export your data to Excel and use the WEEKDAY formula for more in-depth analysis of recurring trends.

Need help? Contact our support team or check out our other guides.

Overview

Speak AI helps you unlock valuable insights from your audio, video, and text data. Instead of sifting through individual files, you can analyze your entire library at once to discover trends and patterns you might otherwise miss.

This feature is perfect for understanding common themes, sentiment, and key entities across a large collection of qualitative data, saving you significant time and effort.

How It Works

You can upload your data, organize it into folders, and then use the Folder Analysis or Explore views to see aggregated insights. This includes word clouds of frequently used terms, sentiment trends, and extracted entities like brands and people.

Additionally, you can use AI Chat to ask specific questions about your entire dataset and get structured answers for each file.

Getting Started

To access this feature, go to Data Upload or Folder Management in your dashboard.

Prerequisites

  • Data files (MP3, MP4, CSV, TXT)
  • Sufficient transcription hours balance

Step-By-Step Guide

  1. Bulk Upload: Upload all your files or import a CSV of text responses.
  2. Organize: Move these files into a single Folder.
  3. Aggregate Insights: Open the Folder and click the Insights tab (or ‘View Analytics’).
  4. Explore:
    • Word Cloud: See frequently used terms.
    • Sentiment: View positive/negative balance across the dataset.
    • Entities: See top mentions of Brands, People, and Locations.
  5. AI Chat: Select all files and run a specific AI Chat (e.g., “What is the main pain point?”) to get a structured answer for every single file.

Troubleshooting

Slow Loading: Large folder analytics may take a moment to generate. Please be patient.

Next Steps

Ready to get started? Here’s what to do next:

  • Login to your account and navigate to the data upload or folder management section.
  • Upload your data and organize it into a folder.
  • Explore the insights to uncover trends and patterns in your qualitative data.
  • Try out AI Chat to get specific answers across your entire dataset.

Need help? Contact our support team or check out our other guides.

Evaluating Speak AI for a team? Book a demo and see your own recordings analyzed.


Related: Insights · Categories

Navigation

Type to search…

↑↓ navigate↵ selectEsc close